Last year (2015) saw the development of a major “El Niño” episode. After more than a year of El Niño conditions, the sea surface temperatures in the Niño3.4 region look like drop below the El Niño threshold. Last month, the average SST anomaly still reflected a strong El Niño (1.6°C) but lower than February’s (2.0°C). The two most common indexes tracking the atmospheric response to El Niño also weakened recently.
The last El Niño event caused the chlorophyll-a depleted in the Central Pacific Ocean. The globes above show us the comparison of the sea surface chlorophyll in the Pacific Ocean observed in October 2014 and 2015. Both images are derived from the Moderate Resolution Imaging Spectroradiometer (MODIS) on NASA’s Aqua satellite. Shades of green indicate more chlorophyll (in milligrams per cubic meter) and blooming phytoplankton. In other hands, shades of blue indicate less chlorophyll and less phytoplankton. The ocean starting to feel the loss of its usual food supply. The historic observations have shown that with less phytoplankton available, fish that feeds on plankton have a greatly reduced food supply. In past El Niños of this magnitude, the decline in fish stocks has led to many marine animals.
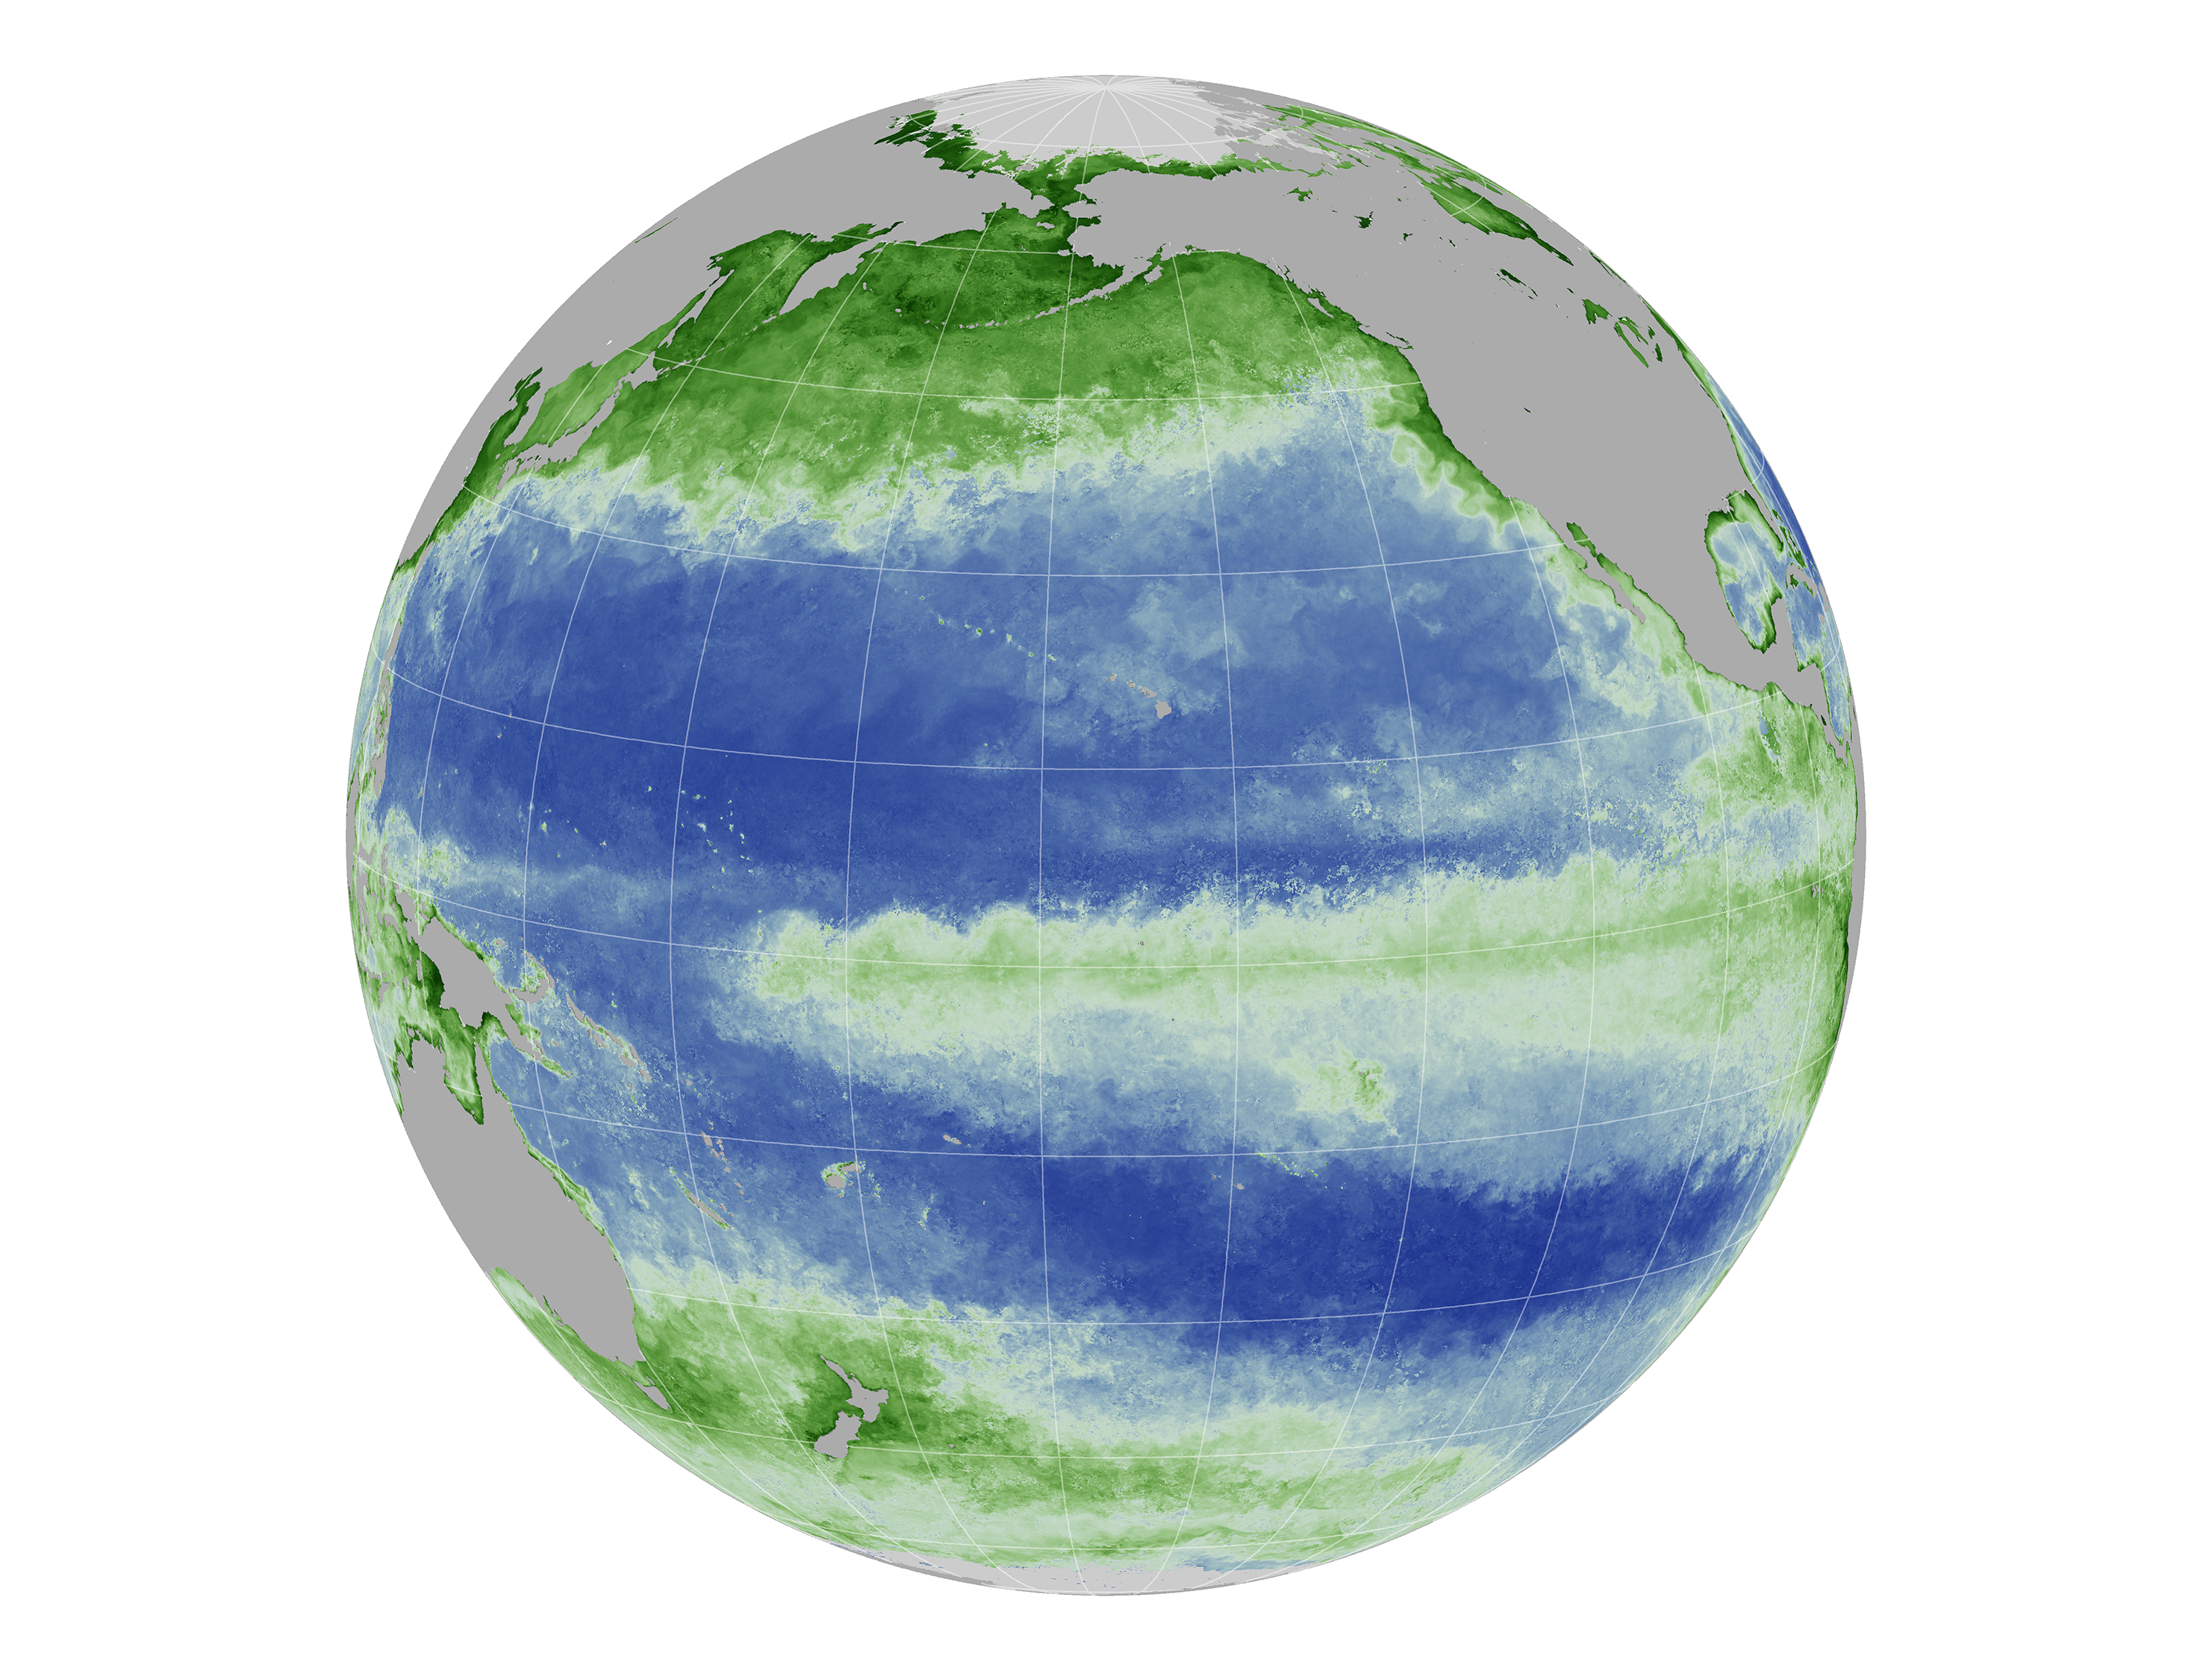
October 2014

October 2015
Moreover, the skipjack tunas distribution and abundance also in relation with an El Niño event. The catchability of tuna depends on the depth of their habitat. During El Niño period, the thermal structure of the ocean changes this depth. The El Niño also impact on the bigeye and yellowfin tuna.

References:
NOAA Climate Prediction Center (2016, April). ENSO blog. Accessed April 29, 2016.
NASA Earth Observatory (2015, October). Image of the Day. Accessed April 29, 2016.

